Last Updated on May 29, 2025
A Mergers & Acquisitions financial model helps evaluate how two companies perform together after a transaction.
This guide walks you through building an M&A forecast in Microsoft Excel—from analyzing historical financials to forecasting synergies, modelling debt financing, and assessing the impact on valuation and returns.
You’ll also learn how to test key assumptions to identify potential risks.
To follow along, you can download my Mergers and Acquisitions Model Template. A complete video walkthrough is also available at the end of this post.
Table of Contents
Step 1. Compare Historical Revenues and Costs from Both Companies
Start by comparing the historical revenues, costs, and key drivers for the acquiring and target companies. Present the figures in a consistent format so they are easy to compare.
For example, separately list historical cash flow items, such as monthly users, revenue, and operating costs. Then, show how the main drivers, such as customer count or market reach, impact the overall cash flow.

Grouping the historical cash flows into consistent categories makes forecasting the synergies arising after the merger or acquisition easier.
Step 2. Forecast Revenue Synergies After the Merger or Acquisition
Analyze how the merger or acquisition could impact overall income by forecasting potential revenue synergies.
For example, my Mergers and Acquisitions Model Template links the addressable users, market reach, and average pricing. The assumption is that the acquisition will increase the customer base, resulting in higher income.

By explicitly showing the revenue synergies, you can make it easier to calculate cash flow gains generated by the acquisition.
📌 If you’d like a broader view of how investment links to growth, my Capital Investment Plan tutorial walks through market expansion and customer reach forecasting.
Step 3. Forecast Post-Acquisition Changes to Variable Costs
After a merger or acquisition, variable costs — the expenses directly tied to customer growth and revenues — may either decrease through efficiencies or increase due to scaling challenges.
Link the customer numbers directly to average cost assumptions, which will help you forecast the overall impact on expenses before and after the transaction.
Here are a few examples of calculating variable costs:
- Customer Acquisition Costs — driven by the number of new customers or sales,
- Customer Support Costs — linked to the existing number of users,
- Other Variable Costs — calculated as a percentage of total revenues.

Acquiring a new company can lead to economies of scale, reducing the average cost per customer. However, in some cases, expanding too quickly may strain operations and temporarily increase expenses.
Step 4. Forecast Headcount Reduction and Opex Synergies
Merging two companies may lead to operating cost efficiencies, especially in staffing and shared resources. Consolidating teams can reduce headcount where roles overlap and eliminate duplicate expenses like extra office space or administrative services.
To calculate synergies in staff costs, track the number of employees before and after the transaction. Then, show which roles are retained, merged, or eliminated, and calculate the resulting cost savings using average salary assumptions.

Use a similar approach to forecast central cost synergies — such as savings in rent, IT systems, legal fees, or management overhead.

By explicitly modelling headcount and operating expense synergies, you can estimate how consolidation will improve the cost base after the acquisition.
📥 To automate staff and expense forecasts, you can download my Mergers and Acquisitions Model Template.
Step 5. Summarize Consolidated Financial Model Results
After forecasting revenues, costs, and synergies, summarize the consolidated financial results to show the full impact of the merger or acquisition.
For example, aggregate the key financials into an annual view. Then, present the historical performance of both companies before the transaction and the incremental contribution of the acquired company after consolidation. Finally, highlight how the merger impacts revenues, costs, and net cash flows.

In addition, analyze the acquisition’s impact on the Profit and Loss Statement and Net Income. Capture significant changes such as synergy gains, depreciation adjustments, tax savings, and new debt servicing costs resulting from the transaction.

Finally, adding visual graphs — such as showing the increase in consolidated revenues from synergies — helps to make financial trends easier to interpret.

📊 For more examples of financial model’s summaries, see my Telecom Model tutorial showing how to structure P&L, cash flow, and a balance sheet.
Step 6. Add Debt Financing and Acquisition Cost Assumptions
When a merger or acquisition requires funding, include debt financing in the financial model. Start by estimating the total capital needed to complete the transaction. Then, specify the proportion financed through debt, also known as the leverage ratio, and forecast debt repayments over time.
One way of estimating the final purchase price is to calculate the target company’s fair value based on historical revenue and apply a revenue multiple. Then, adjust this figure for any acquisition premiums or additional transaction costs.

You can use Microsoft Excel’s PMT function to generate the repayment schedule for simple debt amortization. Remember to split loan repayments into interest expense and principal repayment.
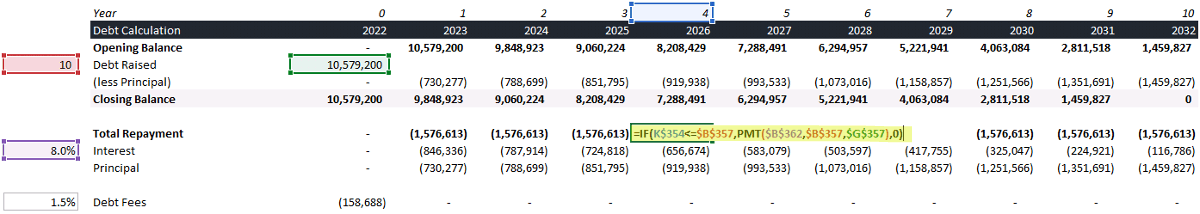
These debt financing assumptions — including the amount borrowed and the repayment terms — will directly affect the balance sheet output in the next step.
📥 To skip the manual setup, you can download my Mergers and Acquisitions Template, which includes a built-in debt module with automated schedules and linked repayments.
Step 7. Assess Valuation and Balance Sheet Impact from the Transaction
After modelling the transaction and debt financing, calculate how the merger or acquisition impacts the company’s valuation and balance sheet.
For example, let’s assume the acquiring company fully absorbs the target’s assets and liabilities. On the balance sheet, recognize any premium paid over the fair value of the acquired assets as goodwill.

Update the consolidated balance sheet in the financial model to reflect:
- New assets acquired,
- New liabilities assumed,
- The creation of goodwill,
- The impact of raised capital or debt used to finance the transaction.
One way to assess the change in company valuation is to estimate the terminal value using an EBITDA multiple. Apply Microsoft Excel’s IRR and NPV formulas to calculate the overall return on investment and the effect of synergies on equity value.

Please note that this tutorial focuses on financial modelling. Accounting treatments for mergers and acquisitions can vary based on regulations and specific transaction terms, so consult a professional advisor for final accounting adjustments. You can read more about merger accounting principles here [external link].
📈 There’s also a helpful walkthrough on modeling returns in my Real Estate Investment Model guide, including IRR and terminal value techniques.
Step 8. Stress Test the M&A Model with Sensitivity Analysis
After building your Merger and Acquisition Model, test various assumptions to uncover the weak spots in your financial model.
You can use Microsoft Excel’s Data Tables to run sensitivity analyses on key drivers. For example, test how changes in debt leverage, acquisition premiums, customer acquisition costs, or market reach affect returns such as IRR and equity value.

By isolating and adjusting one variable at a time, you can identify how vulnerable the investment case is to changes in core assumptions. Stress testing helps businesses better understand risk exposures, plan for different scenarios, and optimize deal structures accordingly.
📌 Recap: 8 Steps to Build a Mergers and Acquisitions Forecast
Here’s a quick recap of the steps we covered to build a complete Mergers and Acquisitions Model:
- Compare Historical Revenues and Costs. Structure the financials of both companies consistently to enable a like-for-like comparison.
- Forecast Revenue Synergies After Acquisition. Estimate how expanding the addressable market and customer base drives post-merger revenue gains.
- Forecast Changes to Variable Costs. Link customer growth to acquisition, support, and revenue-based cost assumptions, including economies of scale.
- Forecast Headcount and Opex Synergies. Identify staffing overlaps and operational savings to forecast post-merger cost efficiencies.
- Summarise Financial Model Results. Aggregate historical and projected results to show the overall impact of the acquisition.
- Add Debt Financing to the Model. Calculate the capital required for the acquisition and model repayments, interest, and leverage ratios.
- Calculate Impact on Valuation and Balance Sheet. Update assets, liabilities, and goodwill; assess how synergies affect company valuation.
- Stress Test the Merger Model. Use sensitivity analysis to test how changes in assumptions impact financial returns and risks.
Following these steps, you’ll build a dynamic Merger and Acquisition Model ready for real-world valuation, transaction planning, and investment analysis.
📥 Download My Mergers and Acquisitions Model Template
This is the exact Excel model used throughout the tutorial—pre-built with all the key components: historical comparisons, synergy forecasts, debt financing, and valuation logic. Everything is linked and automated, so you can focus on your assumptions and see the impact instantly.
This spreadsheet includes a complete merger and acquisition financial model:
- Historical Financial Comparison: organizes and compares revenues, costs, and customer metrics.
- Revenue and Cost Synergy Forecasts: estimates post-acquisition growth opportunities and savings.
- Debt Financing Module: calculates funding needs, leverage ratios, and repayment schedules.
- Cash Flow, P&L, and Balance Sheet Statements: fully links and integrates them to reflect the impact of the merger.
- Valuation and Return Calculations: uses EBITDA multiples, IRR, and NPV to evaluate deal value.
- Sensitivity Analysis Framework: stress tests key financial drivers using Excel data tables.
✔️30-Day Money Back Guarantee included
Video Tutorial on Building a Mergers and Acquisitions Model
My complete video tutorial explains how to create and customize a Mergers and Acquisitions Model using Microsoft Excel.
In the video, you’ll learn:
- How to structure and compare historical financials.
- How to forecast revenue synergies and cost savings after an acquisition.
- How to model debt financing and update the balance sheet for the transaction.
- How to calculate valuation impacts, equity returns, and stress test assumptions.
By the end of the tutorial, you’ll know how to use my Merger and Acquisition Model Template to build dynamic forecasts, evaluate synergies, and analyze transaction returns.

Get in Touch
 Hi, I’m Jacek. I’m passionate about spreadsheets and financial models! I hope this tutorial gave you a strong foundation for building your Mergers and Acquisitions Model.
Feel free to reach out if you have any questions about financial modelling, forecasting, or Excel techniques.
You can also explore my other tutorials for more hands-on guides or check out my One-to-One Training and Financial Modeling Services if you need personalized support.
Disclaimer: This tutorial is for informational and educational purposes only and should not be considered professional advice.
Explore More Tutorials
- How to Create a Project Finance Model — adapt repayment structures and DSCR analysis for deal-level financing.
- How to Build a Cash Flow Forecast — model post-merger cash-flow effects of synergies and financing tranches.
- How to Create a Capital Investment Plan — extends IRR/NPV comparison techniques for M&A project evaluation.
- Real Estate Investment Model — learn how to estimate and value cash flow and yield from initial capital investment.
- Financial Model with Debt Financing — explore including debt calculations into a cash flow projection based on future revenues.
