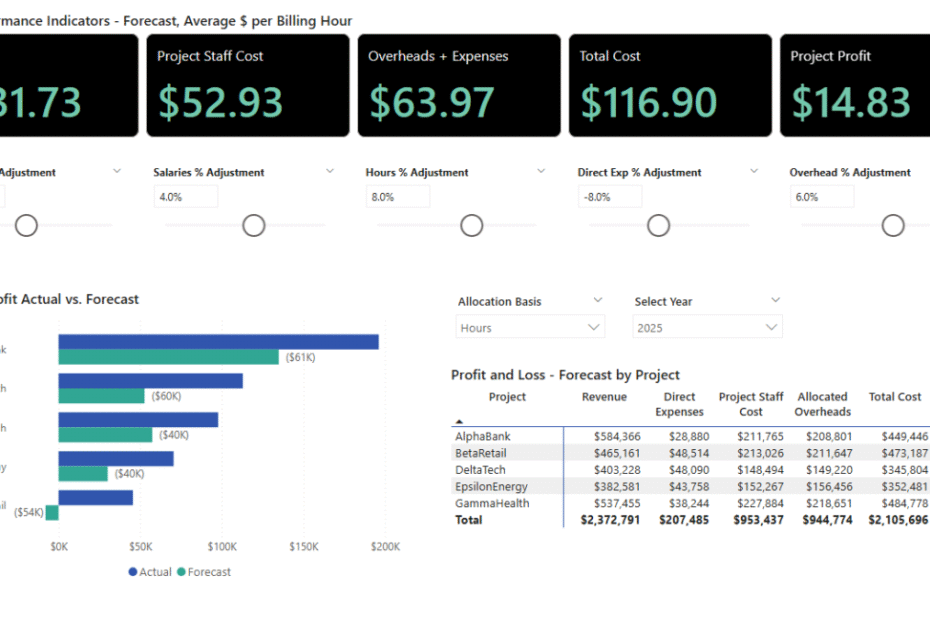
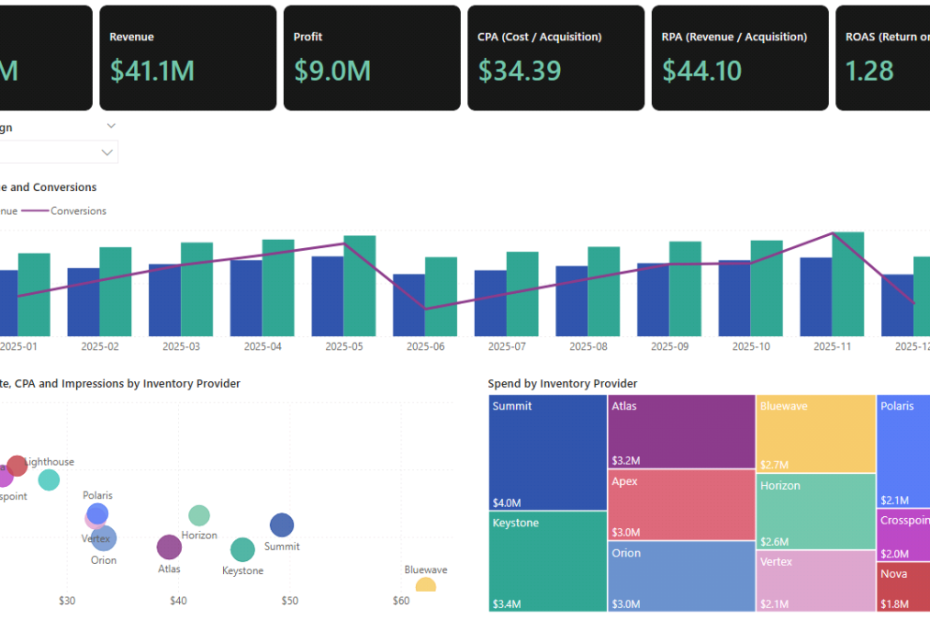
Start Improving Your Spreadsheet Skills and Financial Models
If you need to improve your spreadsheet skills or learn to create simple but effective financial models, you’re in the right place. I have created video tutorials and downloadable Excel templates to help you master the basic functionalities of Excel.
Why Use My Excel Tutorials and Template?
Many job roles will require you to confidently use Microsoft Excel or other spreadsheet programs such as Google Sheets. Spreadsheets are used by businesses in every industry to store and present data, and they are referred to before important decisions are made. So sharpening your Excel abilities with my tutorials can help you advance your professional development and become a valued member of any company.
For business owners, having at least a basic understanding of Excel and Financial Modelling is also hugely important. Spreadsheets and financial models can help you clearly display and understand your business data, so you can easily assess information about your business’s performance and use data to make informed decisions. My tutorials and financial model templates can help you streamline the financial modelling process so you can spend more time using data insights to take action and make improvements to your business processes.
A Beginner’s Introduction to Excel
If you’re new to Excel and the world of spreadsheets, this is the tutorial for you. This bitesize tutorial can help you grasp the basic functionalities of Excel. You will learn the difference between relative and absolute references, and I will introduce you to basic formulas. The tutorial will walk you through the process of automating calculations and creating a basic table using these formulas.
Learn More: Your First Steps in Excel – Beginner’s Crash Tutorial
An Introduction to Financial Modelling
In this tutorial, I walk you through creating a simple cash flow model. Cash flow models allow you to predict any cash surpluses or shortfalls and plan to minimise the impact of shortages. They also allow you to keep track of spending, profitability and your business’s value, and demonstrate your business’s performance to potential lenders or investors.
This tutorial will help you create a clear and easy-to-understand cash flow model using a pre-made Excel template. The tutorial will also help you understand how to use and read the cash flow model and the correlation between different data elements.
The model will contain the following pages:
- Contents Page
- Assumptions Page — This page lists the main drivers of growth in costs and revenue. It considers factors affecting monthly income, such as one-off charges, recurring fees, and employee salaries.
- Cash Flow Model — The cash flow model details factors affecting costs and revenue in each month of the year over 60 months.
- Summary and Returns — This page summarises the findings of the cash flow model. It presents your total revenue, cash flow, and return on investments.
- Graphs — Like the Summary and Returns page, the Graphs section of the model is designed to help you understand and visualise your business data.
The formulas used to create this spreadsheet model include IF (conditional statements), SUMIFs, Relative and Absolute referencing, IRR and DATE functions.
Learn More: How to Build a Cash Flow Forecast in Excel
Extended Financial Modelling Tutorial and Template: Expand Your Cash Flow Model
The above tutorial and template are designed to help you create a simple cash flow model. However, you may want to expand and build on the model above. That’s where my Extended Financial Modelling tutorial and template come in.
With this tutorial and template, you can create a simple cash flow model with additional functionalities:
- Model Scenario Builder — The use of INDEX formulas allows you to quickly test how the outcome of the model differs with different sets of assumptions.
- Returns / Capital Structure Page — This page extends the use of IRR and NPV functions to calculate Discounted Cash Flow (DCF) and return on investments for different tranches of investors.
- Debt Modelling — Using financial functions such as the Excel PMT function, this tutorial and template can help you create a debt repayment model with simplified calculations of interest and principal repayments.
- Detailed Profit and Loss (P&L), Cash Flow and Balance Sheet Statements —These additional statements can give you a deeper understanding of your business’s financial performance.
Learn More: How to Build a Cash Flow Forecast in Excel
Get Help with My Financial Modelling and Cash Flow Forecasting Consulting Services
If you need to create your own Cash Flow Forecast in Excel, visit my Financial Modelling Consulting page to find out more about my services.
With extensive financial modelling experience, I can help you make sense of your numbers and give structure and meaning to the data behind your business.
I will create a wide range of user-friendly, easy-to-follow Excel Cash Flow Forecast Models that analyse your data, summarise insights, and visually present findings with graphs and charts.
Related Blog Posts:
How to Build a Forecast Cash Flow Statement in Excel
How to Create a Subscription Model with Churn Calculation
How to Create a Capital Investment Plan in Excel
How to Create an Excel Financial Model with Debt Financing
How to Create a Telecom Investment Model in Excel
How to Create a Real Estate Investment Model in Excel
How to Create a Marketing Investment Plan in Excel
How to Create a Project Finance Model in Excel
How to Use Cohort Analysis to Calculate Retention and Churn Rate
Develop Your Skills Further With My One-to-One Courses
Hopefully, these tutorials and templates have helped you come to grips with the basics of Excel and financial modelling. But if you’re looking for further guidance on using Excel and creating professional financial models, check out my one-to-one Excel courses.
I have developed courses to help you master a range of spreadsheet and data skills, from data analytics to business planning and financial modelling, to Python programming. With my Excel crash course, you can delve deeper into the capabilities of Excel, and further develop your data skills.
The one-to-one nature of my courses also means I can adjust lessons to suit your level of experience and pace of learning.
What Our Customers Say
Why Choose ChallengeJP?
- Over 10 Years of Experience — With over 10 years of experience in Commercial Finance and Data Analysis, I have helped businesses in many different industries to make sense of their data.
- Take Control of Your Data — Whether you use my consultancy services or Excel training courses, you’ll be in control of the process and the result — you can decide what you want to learn yourself, and which aspects of data analysis you’d like me to take care of for you.
- Personalised One-to-One Solutions — I offer personalised solutions to help you master spreadsheets and maximise data value. My courses are held on a one-to-one basis so I can tailor them to your skills and pace of learning. I also tailor my consultancy services to your business needs and desired results.
- Hands-On Learning Experience — Listening, watching and taking notes can only get you so far. So ChallengeJP courses give you the chance to apply lessons to practical examples. With hands-on learning experience, you’ll develop confidence using and creating spreadsheets.
- Competitive Pricing — All of the ChallengeJP services are competitively priced so you can get the help you need without breaking the bank. Whether you use my Excel courses and training to develop your skills, or you bring me on board to help with a business project, I will always offer you fair and competitive prices.