Consolidate Multi-Subsidiary P&L and Forecast with Confidence
This ready-to-use Power BI template helps you consolidate Profit & Loss across subsidiaries, apply FX conversion to a reporting currency, analyze profitability, and build scenario-driven forecasts — all in Microsoft Power BI.
The package includes a fully built Power BI (.pbix) file, sample datasets, mapping tables, DAX measures, and interactive visuals — so you can go from raw accounts to board-ready insights in minutes.
Perfect for FP&A, finance teams, controllers, and data analysts.
You Will Be Able To
📊 Consolidate Accounts Across Subsidiaries
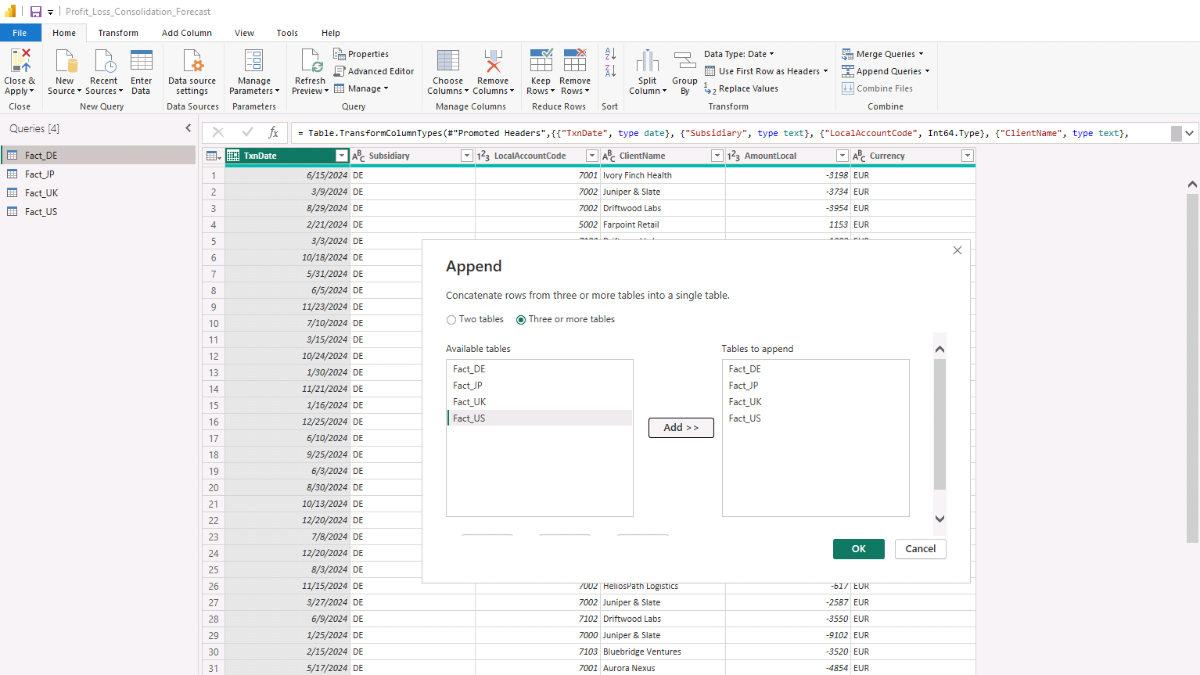
Append multiple Fact tables (e.g., UK/DE/JP/US) into one dataset and standardize categories (Revenue, COGS, OPEX).
💱 Apply FX Conversion to a Reporting Currency
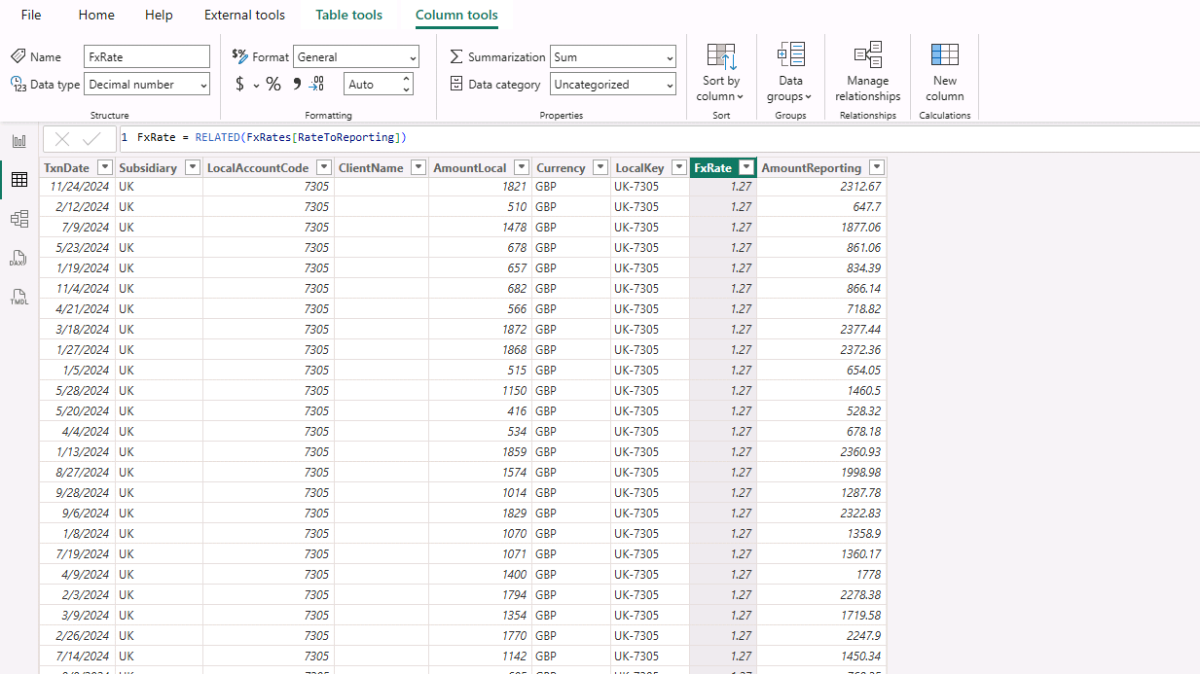
Bring in FX rates and compute reporting amounts (e.g., USD) with transparent, editable DAX.
🧭 Use a Robust Calendar for Time Intelligence
Auto-generated date table with IsActual and IsForecast flags for monthly/annual views.
📈 Build Core P&L & Margin Measures
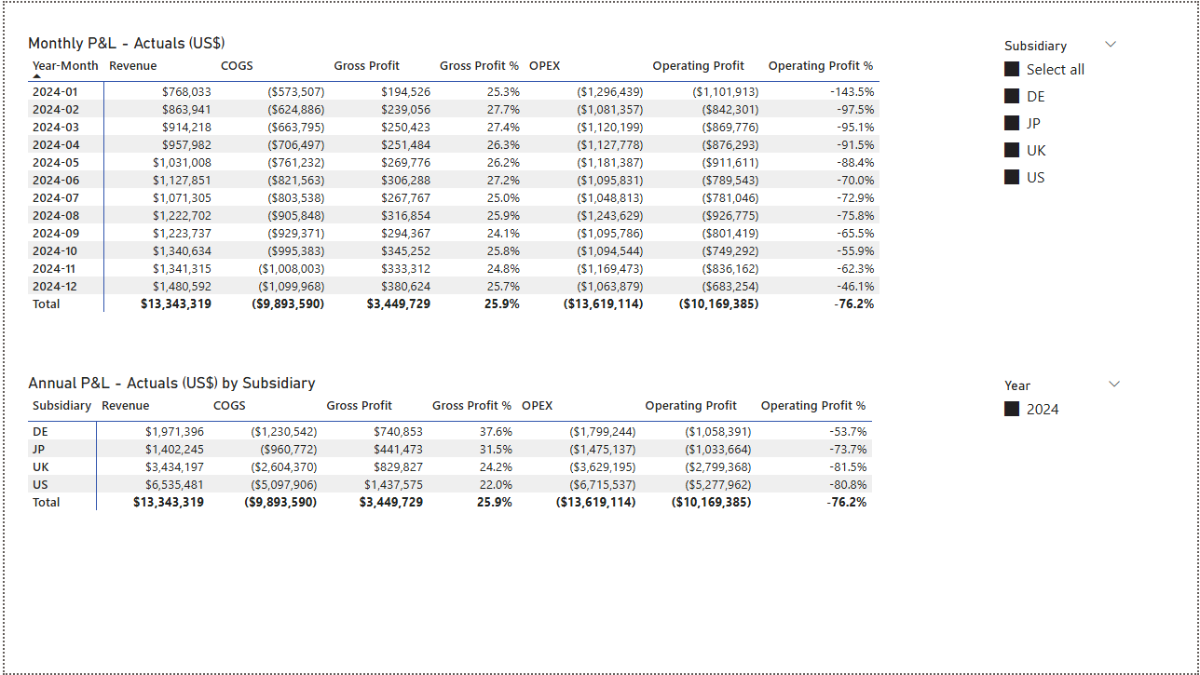
Revenue, COGS, OPEX, Gross Profit, Operating Profit, and margins — signed correctly for clean financials.
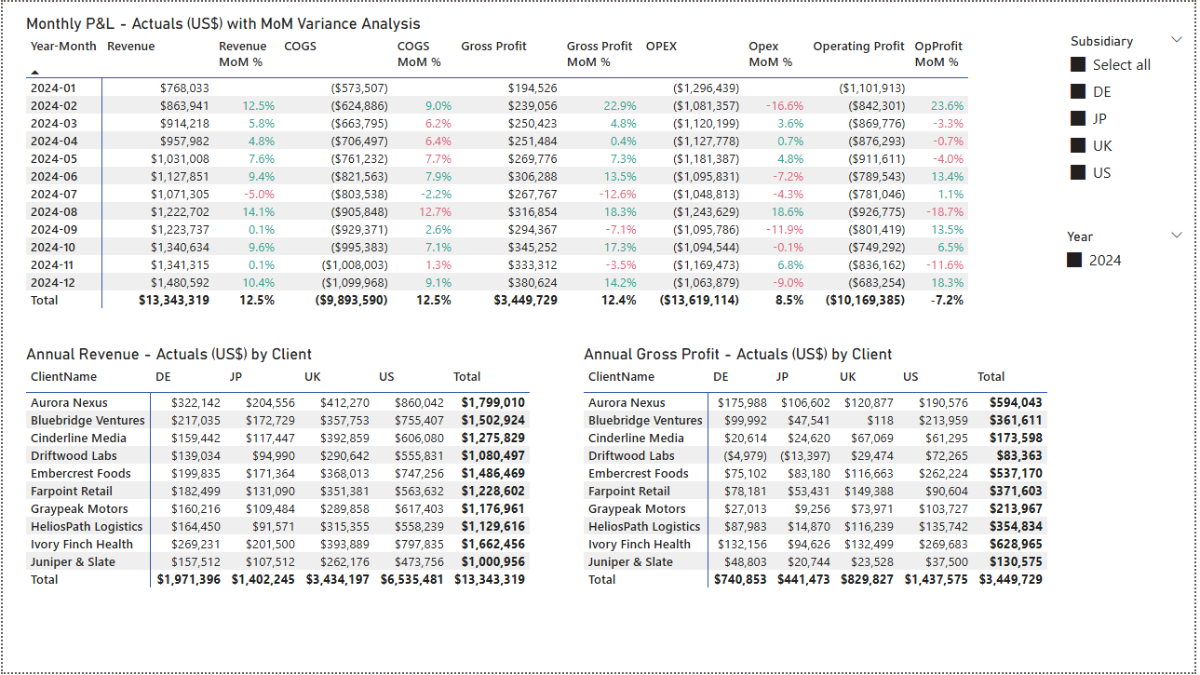
🔁 Run Month-on-Month Variance Analysis
MoM Δ and % for revenue, costs, GP, and OP to explain performance shifts.
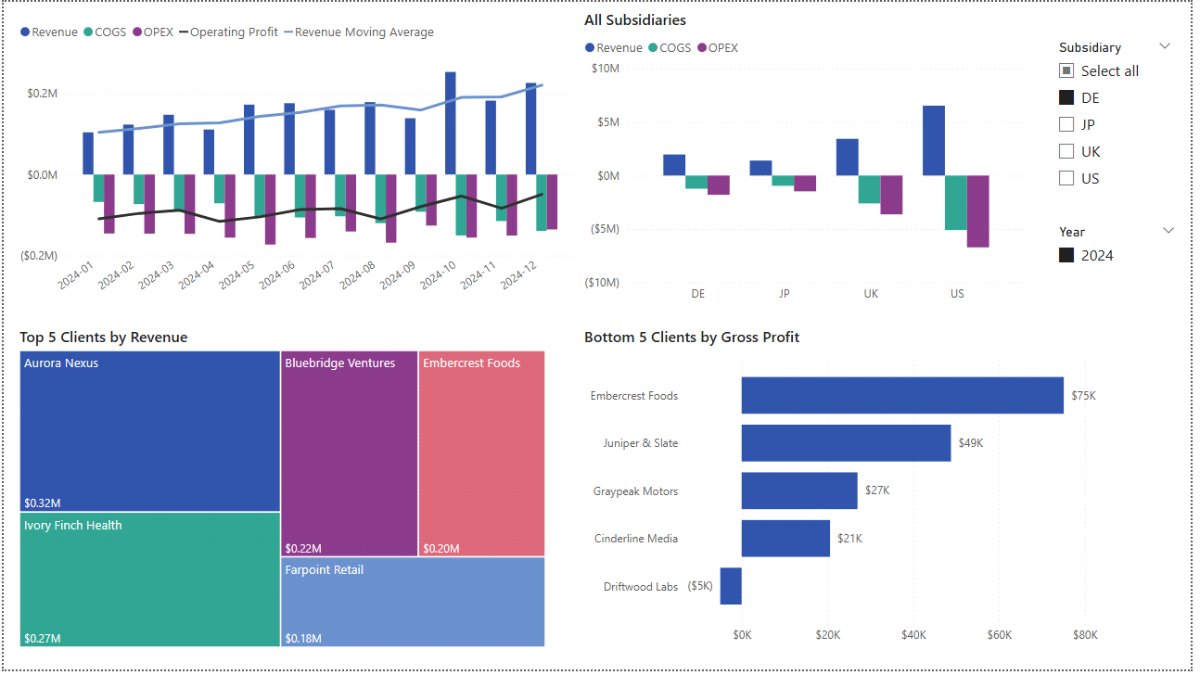
👥 Analyze Profitability by Client & Subsidiary
Top revenue contributors and least-profitable clients with matrix and treemap visuals.
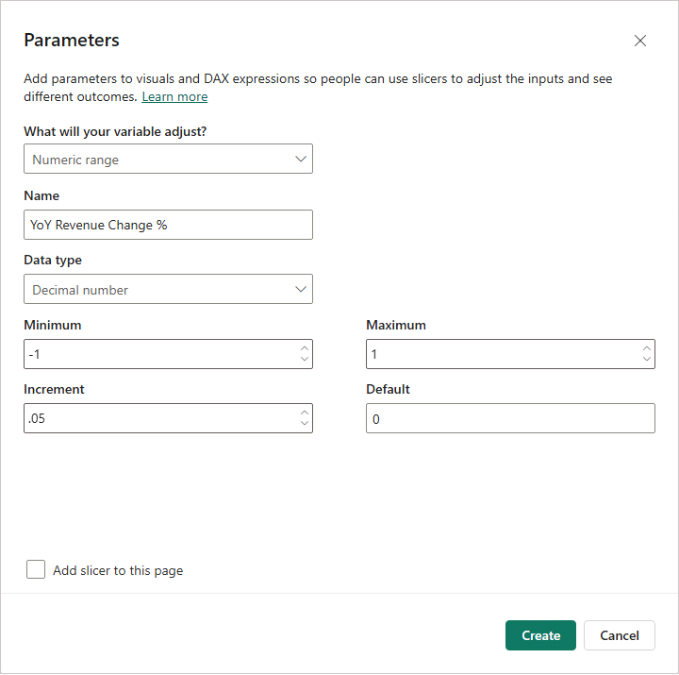
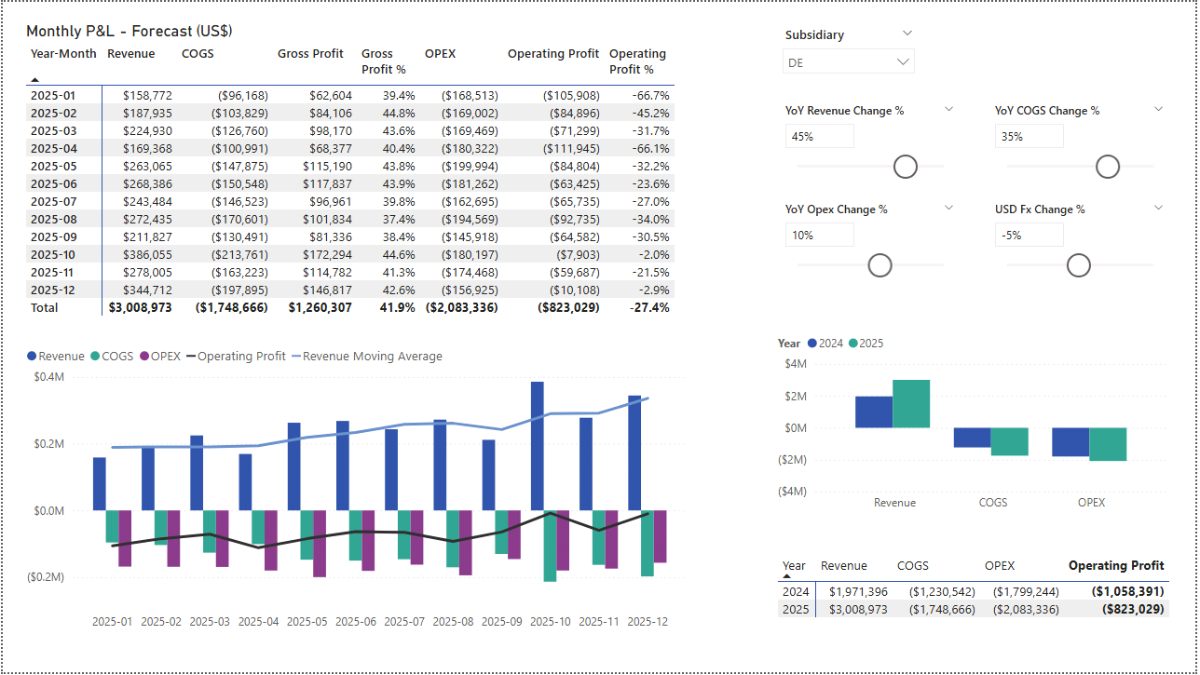
🧮 Forecast with Scenario Parameters
YoY % assumptions for Revenue/COGS/OPEX and USD FX to build a 12-month forecast.
🧰 Edit Everything Easily
Fully editable PBIX + CSVs — no locked logic or hidden dependencies.
New to Microsoft Power BI Desktop?
Download it free from Microsoft, open the included .pbix, and replace sample CSVs with your data to use the template with your business.
Built for Real-World Consolidation & Forecasting
This template goes beyond simple charts — it connects all the pieces you need for practical consolidated reporting and forecasting:
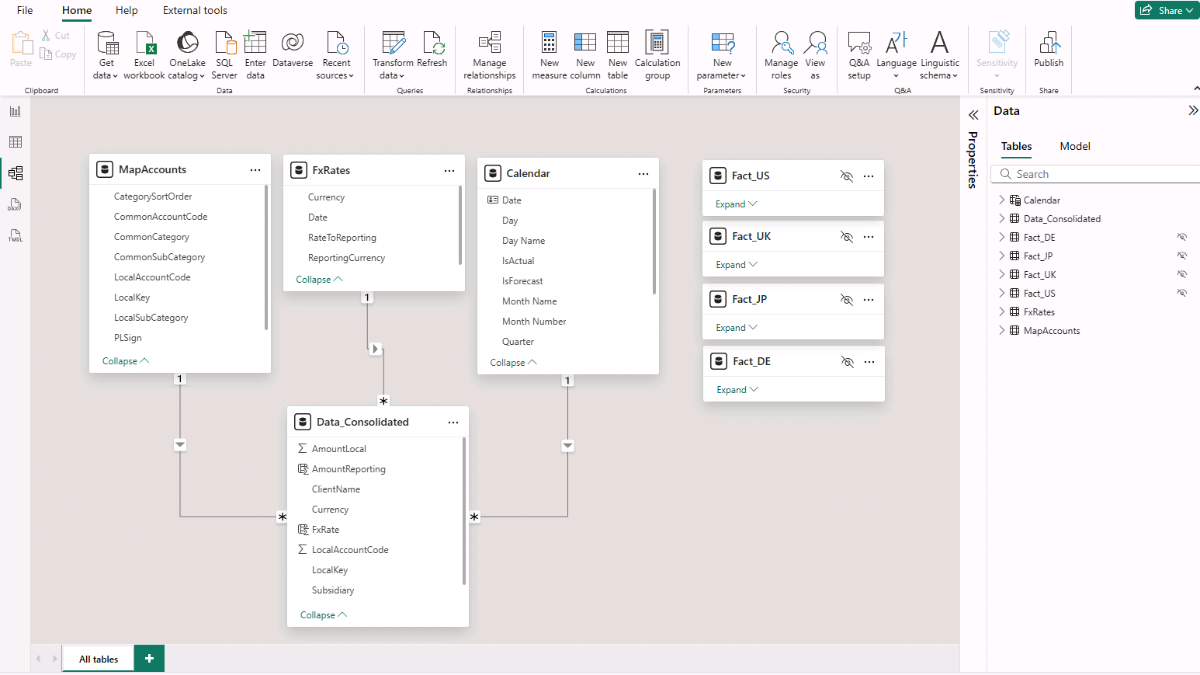
- Clean data model across consolidated Fact, FX rates, account mapping, and Calendar
- Autogenerated Calendar table that extends one year beyond actuals for forecasting
- Calculated columns for reporting currency amounts (FxRate, AmountReporting)
- DAX measures for signed amounts, GP/OP, margins, and MoM variance
- Client & subsidiary analysis with dedicated lookup tables
- Forecast measures driven by YoY parameters and FX adjustment logic
- Interactive dashboards for Actuals, Variance, and Forecast scenarios
Evaluate consolidated performance, test scenarios, and communicate results with confidence.
Template Preview
🔍 Click on the product images above to see a preview of the Consolidated P&L & Forecast Data Template in detail.
Explore example pages for monthly/annual P&L, variance analysis, client profitability, and forecast dashboards with parameter sliders.
See the Template in Action
▶️ Step-by-Step Tutorial
Learn how to build the full model: load & append data, create account mapping and calendar, define relationships, write P&L/variance/forecast DAX, and visualize consolidated results.
Read the full tutorial
Why Choose This Template?
- Save time with a ready-to-use, fully customizable Power BI file
- Designed for multi-entity consolidation and FP&A workflows
- Handles FX, signed P&L logic, variance analysis, and forecasting
- Simple, clean structure — clearly named measures and fields
- Professional outputs for team reviews and board updates
- Risk-free with a 30-day money-back guarantee
Risk-Free Purchase
I stand behind my products with a 30-day money-back guarantee — if you’re not completely satisfied, simply request a full refund, no questions asked.
✅ Secure Checkout | ✅ Instant Download | ✅ 30-Day Money-Back Guarantee



Reviews
There are no reviews yet